Lidar applications in wind energy
Lidar technology is simple to install and use for various wind energy measurement needs. Vertical profiling lidar is accepted for bankable Wind Resource Assessment (WRA) campaigns across different regions, and the benefits of pulsed lidar are well documented and validated in many commercial campaigns.
There are typically three scenarios where lidars can be used for bankable WRA campaigns:
- Standalone lidar applications
- Co-location with a met mast for vertical extrapolation
- Met mast + a moving lidar for spatial coverage to reduce horizontal uncertainty
All these scenarios contribute to measurement uncertainty reduction thanks to the operational capabilities and accuracy of the lidar. WindCube® lidar measures up to 300 m and its embedded hybrid wind reconstruction algorithm is IEC classified by DWG, showing excellent results: at 120 m, WindCube v2.1 classification uncertainty is 1.1%. Scalar and vector WFR data (before hybridization) are available to download from WindCube as well.
Many wind farm projects have been financed with standalone lidars, and the number is increasing quicker than ever before. In general, we have seen good acceptance of standalone lidar measurements, but this can vary from one region to another due to local practices. It is a good practice to work with local third-party consultants who are familiar with local legislation and practices and can streamline the acceptance of standalone lidar campaigns. On our side, we closely work with all main independent consultants such as DNV, DWG, UL, DTU, PAVANA and GEO NET to verify lidars for bankable wind measurements. The acceptance of standalone lidar is expected to increase even further with the release of IEC 61400-15-2.
Lidar can also be used for Permanent Wind Monitoring instead of the met mast. It is expected that lidar will fully replace met mast measurements onshore in the next two decades as it has several advantages such as easier and less frequent maintenance, high availability in different climates, and it delivers accurate data at higher altitudes. It can also be easily relocated to support other measurement campaigns unlike met masts. Permanent met mast (PMM) requirements are typically set by the offtaker, and sometimes strictly regulated. Engage with the regulator or offtaker early during your transition from WRA to operations to verify requirements for PMM equipment. WindCube communications include Modbus, which is frequently used for real-time reporting of onsite wind conditions on active wind farms.
In offshore wind farm applications, lidar has already almost fully replaced met mast measurements as it is more cost effective and much easier to use and install. WindCube lidar has been validated and accepted for offshore measurements either as part of the Floating Lidar System (FLS) or as a fixed offshore installation on platforms, lighthouses and islands. WindCube is validated by several buoy integrators according to the Carbon Trust OWA. HERE is a case study with AKROCEAN on the bankable offshore WRA in France. Vaisala is also part of the IEC 61400-15-4 working group, developing a dedicated standard for floating lidars.
Lidar performance under different environmental conditions

WindCube lidar is designed to withstand various environmental conditions and is validated through numerous commercial deployments in all regions of the world. Recent WindCube enhancements further increase performance, reliability and uptime of the system in challenging environments. For example, WindCube is now equipped with a metallic, corrosion-resistant to ensure uninterrupted performance during heavy rain and snow. When it comes to precipitation conditions, WindCube v2.1 performs very well, with R2 > 0.99 compared to collocated high quality anemometry during precipitation events. These proofs are included in the Data Analysis Guidelines HERE.
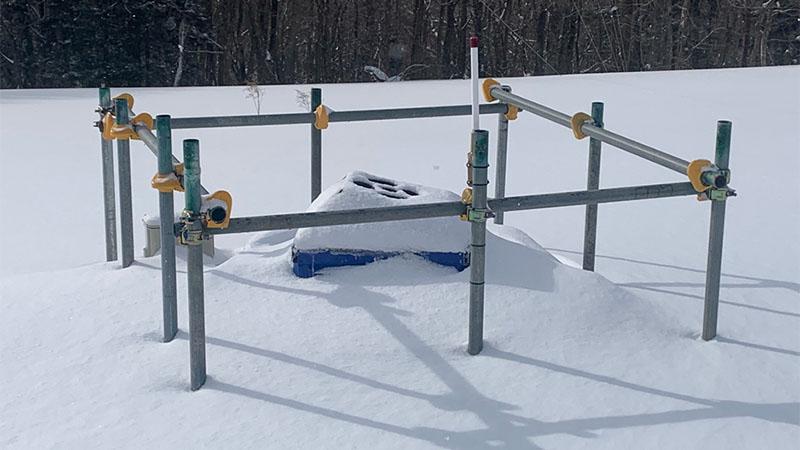
In heavy snow areas, lidar can be equipped with a winter kit to avoid snow and ice accumulation on the lidar window. When it comes to obstacles, it is easy to identify and quantify the specific sector affecting the lidar measurements. If there is an obstacle in one of the lidar's lines of sights, it will be visible in the Carrier-to-Noise ratio (CNR) of the lidar. This is easily traceable during the installation of the lidar through WindCube Insights – Fleet software. As a general rule, Vaisala recommends avoiding siting WindCube in locations where a change in the natural or built environment could occur and block one or more beams intermittently or permanently.
Data availability is another important topic when it comes to wind measurements. Any type of lidar needs a sufficient number of aerosols in the atmosphere to get laser light backscattered. Data availability of pulsed lidars is well documented, stable and predictable. Several customers have published studies which allow to transparently share the data availability results. For instance, a study from juwi based on 50 WindCube campaigns and a study from Kjeller Vindteknikk in a Nordic site are the most representative:
- WindCube data availability is on average ~70% in worse cases at typical hub heights (100-140m)
- And superior to 95% in standard cases
Vaisala has published a detailed analysis of the uncertainty of WindCube measurements in clean air environments, with specific examples for how to use WindCube measurements with low 10-minute availability while complying with IEC 61400-50-2 (today's recognized standard). This requires adding a small, additional uncertainty based on the CNR and 10-minute availability using lookup tables provided in the published document HERE.
When planning met campaigns in regions with possible clean air conditions, WindCube users may contact Vaisala Technical Support and request a Data Availability and Range Estimation report which uses satellite measurements and reanalysis data to simulate the WindCube or WindCube Scan availability at the proposed location. Read more about it HERE.
Also, there is a growing interest and need for lidar Turbulence Intensity (TI) measurements in the wind energy community, especially during site suitability campaigns. Lidars measure wind speed in a different way than met mast anemometry. Lidar TI generally measures higher TI than cup measurements. This is caused by a variety of physical mechanisms, include the volume average of the lidar pulse, spatial separation of the lidar beams, and the sampling rate of the lidar. Vaisala is developing a machine-learning based correction, validated at five onshore campaigns. See more information HERE. Broad industry consortia such as CFARS and the DNV-JIP have been working to create validation frameworks for machine-learning or other adjustment algorithms between lidar and cup TI measurements:
- DNV JIP aims to develop a new Recommended Practice to support wider acceptance and adoption in industry standards of TI measurement by lidar.
- CFARS Site Suitability Initiative is an Open-Source Approach to evaluate the performance of Remote Sensing Device (RSD) Turbulence Intensity measurements & accelerate industry adoption of RSDs for Turbine Suitability Assessment.
IEC 61400-15-2 standard and lidar verification

IEC 61400-15 will define a framework for assessment and reporting of the wind resource, energy yield (15-2) and site suitability input conditions (15-1) for both onshore and offshore wind power plants. The IEC is holding regular in-person meetings with the goal of completing the committee draft in 2023.
How will the new standard change lidar measurement campaigns?
- Standalone lidar usage explicitly allowed in flat terrain
- Third party, off-site validation campaigns used for traceability
- Validation and Classification of devices largely follow IEC 61400-12-1
- Minor updates to some measurement uncertainty sub-components
- Guidance on data availability requirements based on historical variability
- Best practices for documentation, traceability, maintenance and campaign planning
Why should lidars be verified before and after the measurement? What can be changed in a lidar system after two years?
There are a variety of sub-components in the laser chain (LC) that can degrade over time. Vaisala recommends a three-year maintenance cycle, which is conservative and well within these component lifetimes. Verifying lidar performance before and after a met campaign ensures traceability of the estimated uncertainties, with the offsite met masts acting as the "backup sensors" in this use case. A post-validation can serve as pre-validation for the following met campaign, for a different project.
For many years, Vaisala has been working with several independent third-party consultants to verify WindCube lidars and to ensure bankable lidar measurement campaigns. Thanks to our partnership with PAVANA GmbH, WindCube lidar can be verified against an IEC-compliant 200 m met mast to support a growing need for measurements at higher altitudes.
What is the average verification campaign duration in summer and winter at the PAVANA test site?
The average lidar verification campaign at PAVANA test site takes three weeks for satisfactory wind speed range coverage. During individual stationary weather situations, it might take longer to measure the higher wind speeds in summer and the lower wind speeds in the winter period.
What about guy wires effects when doing the verification of the lidars?
Due to PAVANA’s special verification setup of the booms, which have a 120-degree offset to each other, PAVANA can detect mast and guy wire effects quite easily in the data and minimize these effects dramatically. The effect of the guy wires on the WindCube measurements is minimized by considering the geometrics and by tracking the CNR values of each beam.
Out of the 100 tests done by PAVANA, how many indicated being out of specs? Would this have any bearing on the conclusions to have a failure at all with a lidar?
The percentage of lidars being out of specs is hard to quantify, since this is highly dependent on the device, version number and manufacturer. For WindCube v2.1 with the hybrid algorithm, PAVANA sees a very low single-digit percentage out of specs corresponding to specific hardware malfunctions which can usually be fixed.
Hybrid wind field reconstruction directly reduces measurement uncertainty
In the paper on Behavior and mechanisms of Doppler wind lidar error in varying stability regimes, an applied math graduate Rachel Robey and Professor Julie K. Lundquist discussed how they used atmospheric simulations at Large eddy simulation (LES) scale with weather and research forecasting model in order to assess how atmospheric characteristics affect the performance of measuring systems such as lidars. The papers highlights that lidar 10-min averaging significantly improves the accuracy, and the weighting between scalar averaging and vector averaging (hybrid) also improves the wind speed bias compared to cup anemometry.
The full presentation is presented during the latest Innovations webinar, and here are Rachel’s and Julie’s take always based on the webinar questions:
Do you plan/did you do any comparisons of your study's results with in-situ observations?
We don’t have any immediate plans to compare directly with field data. The magnitudes we saw in our 10-minute errors for the simulated WindCube agree with general findings in previous instrument verification campaigns (below), but more exact comparisons would best be completed in a case study simulating the particular conditions of a case study.
Cariou, J.-P. and Boquet, M.: LEOSPHERE Pulsed Lidar Principles, in: UpWind WP6 on Remote Sensing Devices, 1–32, Orsay, France, 2010.
Courtney, M., Sathe, A., and Gayle Nygaard, N.: Shear and Turbulence Effects on Lidar Measurements, Report, DTU Wind Energy, ISBN 978-87-93278-01-1, 2014.)
You looked at atmospheric stability and the impact on reconstruction error. What meteorological variable / parameter would you like to look at next if you were to continue this study or do a follow-on study?
For the lidar model, incorporating dependence of the radial velocity measurement on aerosol distributions could be interesting, especially if we expect large differences e.g., with height. As far as atmospheric conditions, we could expand from the ‘baseline’ in the initial study to re-introduce more complex conditions like turbine wakes, complex terrain, or other heterogeneities in the flow and consider not just how mean differences but differences in the turbulent statistics across the scan volume propagate into the error.
How do you capture the combined error of stable BL and strong CBL, or any multiple errors?
The distribution of errors will be unique to the conditions in which measurement(s) are being made (we picked three representative cases: Strong CBL, Weak CBL, stable BL). Combining the errors would group the errors seen across the conditions all together in one distribution (where the furthest outliers would likely be from the Strong CBL and a more distinct peak of errors closer to zero would appear from the stable BL). However, since transitions between conditions happen gradually (on the order of hours), we find it most useful to disaggregate the cases to better understand the distinctions in the behavior in errors and tailor the treatment more closely to when each set of measurements is made.
We’d love to talk to you
Interested in learning more? Please contact Kimberly Mufi to schedule a discussion.
